Autonomous frost protection systems activated across a blooming commercial orchard at dawn

The Grow Environment

Precision agronomy powered by AI agents, autonomous drone fleets, and IoT sensor meshes. From the first frost warning to the final fruitlet count, Zooberry’s Grow Environment converts raw environmental data into autonomous orchard decisions—24 hours a day, online or offline.

AI-powered solar weather station with LoRaWAN antenna array monitoring a pear orchard microclimate zone
Predictive AI + IoT

Frost Defender AI

Spring frost is the single largest catastrophic risk in deciduous fruit production. A single night at 28°F during bloom can destroy an entire crop. Zooberry’s Frost Defender AI replaces the grower’s 3 a.m. alarm clock with a fully autonomous protection system that predicts, decides, and acts—without human intervention.

Predictive Ensemble Model. Frost Defender fuses data from three tiers: macro-scale NWS and ECMWF weather models, meso-scale WRF downscaling to 1 km resolution, and micro-scale readings from your own sensor grid deployed at 50-meter intervals across the orchard. The ensemble produces a 72-hour rolling frost probability forecast with block-level granularity—you see not just “frost tonight” but “Block 14 drops below 31°F at 4:47 a.m. with 87% confidence, while Block 3 stays at 34°F.”

IoT Sensor Integration. Zooberry integrates natively with Davis Instruments Vantage Pro2, Onset HOBO MX2300 series, and Meter Group ATMOS 41 stations. All sensors communicate over a private LoRaWAN mesh (Kerlink or MultiTech gateways) with sub-second telemetry to the Orchard Node. Wet-bulb temperature, dew-point depression, soil temperature at 4-inch depth, wind speed, and inversion-layer gradient are all ingested continuously.

Autonomous Trigger Cascade. When the model crosses the action threshold, the Orchard Node issues commands directly to frost-mitigation hardware via Modbus TCP, GPIO relay, or cloud API:

  • Wind machines — Orchard-Rite or Chinook units activate in staged sequence from coldest block outward, mixing warm inversion air downward.
  • Overhead sprinklers — Irrigation valves open to apply latent-heat protection at 0.10–0.12 in/hr, the precise rate to form an ice shell without over-saturating the root zone.
  • SmartBee infrared heaters — Propane-fired radiant heaters ignite in frost pockets identified by the sensor grid, targeting the coldest 10% of acreage for maximum fuel efficiency.

Edge Inference on NVIDIA Jetson Orchard Node. The entire prediction-to-actuation pipeline runs on the solar-powered Jetson Orin NX at your equipment shed. When cellular connectivity drops at 3 a.m.—as it often does in rural orchards—Frost Defender continues operating without interruption. TensorRT-optimized models deliver inference in under 200ms on 8 GB of local memory.

Alert Cascade. Even though the system acts autonomously, growers stay informed. The alert chain fires simultaneously: SMS to the orchard manager, push notification to the Zooberry mobile app, voice call to a backup number, and a real-time event logged to the Digital Twin timeline. Post-event, Frost Defender generates a protection report with actual vs. predicted temperatures, equipment run times, fuel usage, and an estimated crop-save value in dollars.

Macro photograph of apple blossoms at king bloom stage with AI phenology overlay visualization
Deep Learning + Phenology

Bloom Predictor Neural Network

Timing pollination is a multi-million-dollar decision. Deploy beehives too early and colonies deplete before king bloom. Deploy too late and you miss the fertilization window entirely. Zooberry’s Bloom Predictor Neural Network eliminates the guesswork by modeling bloom progression at the individual-block level with day-level precision.

10+ Years of Chill-Hour Deep Learning. The model was trained on over a decade of chill-hour accumulation data (Utah model, Dynamic model, and Modified Utah model) correlated with actual bloom dates from 140+ cultivar-rootstock combinations across Washington, Oregon, Michigan, New York, and Chile. The LSTM-Transformer hybrid architecture captures both long-range seasonal trends and short-term temperature anomalies that trigger early break.

Phenological Stage Prediction. Bloom Predictor tracks and forecasts seven distinct phenological stages for each block:

  • Dormant — Chill accumulation tracking and rest completion estimation
  • Silver Tip — First visible bud swell; 7–10 days before bloom
  • Green Tip — 0.5 inch green tissue; frost sensitivity increases
  • Tight Cluster — Individual flower buds visible but unopened
  • Pink (First Pink) — Petal color visible; 3–5 days to king bloom
  • King Bloom — Central flower open; optimal pollination window begins
  • Petal Fall — Pollination window closing; fruitlet development begins

Beehive Rental Optimization. Contracted bee colonies cost $75–$125 per hive, and most orchards need 1–3 hives per acre. Bloom Predictor issues a “Deploy Bees” signal 48 hours before predicted king bloom, synchronized with the apiary’s delivery schedule. By eliminating the typical 3–5 day buffer growers use as insurance, Zooberry reduces hive rental duration by 20–30%, saving $50–$200 per acre annually.

Pollination Drone Integration. When the real-time bee-density sensor (acoustic monitors + entrance counters on hive scales) detects insufficient pollinator activity—below 8 bees per tree per minute during peak bloom—Zooberry’s Fleet Command can deploy DJI Agras T40 drones equipped with pollen-dispersal payloads. The drones fly pre-programmed pollination routes at 1.5 m above canopy height, delivering a targeted mix of compatible pollen collected and dried from the operation’s own pollenizer rows.

ROI Impact. In a 500-acre Honeycrisp operation, optimal pollination timing increases fruit set by 8–15%, translating to 200–400 additional bins at $800+/bin wholesale. Combined with hive rental savings, the Bloom Predictor module alone can generate $50,000–$120,000 in incremental annual value.

Sunlit pear orchard canopy with AI disease detection overlay highlighting early fire blight symptoms
Computer Vision + RAG

AI Scout — Disease RAG Pipeline

Traditional disease identification requires a scout to drive every row, photograph suspicious tissue, email it to an extension agent, and wait 24–72 hours for a response. Zooberry’s AI Scout delivers a research-grade diagnosis in under 3 seconds, directly on the grower’s phone—or autonomously from drone imagery.

How the RAG Pipeline Works. When a grower photographs a leaf, fruit, or shoot, the image is processed through a four-stage pipeline:

  • Stage 1 — CLIP Embedding: The photo is encoded into a 768-dimensional vector using a fine-tuned CLIP ViT-L/14 model trained on agricultural pathology imagery.
  • Stage 2 — Vector Search: The embedding queries a FAISS HNSW index containing 50,000+ labeled disease images sourced from WSU Tree Fruit Extension, UC Davis IPM, USDA ARS germplasm archives, and validated grower submissions. The top 12 nearest neighbors are retrieved with cosine similarity scores.
  • Stage 3 — Contextual Retrieval: Alongside image matches, the system retrieves corresponding text chunks from a 2.4M-token knowledge base: spray guides, resistance management protocols, PHI (pre-harvest interval) tables, and peer-reviewed phytopathology papers.
  • Stage 4 — LLM Diagnosis Generation: The matched images, text context, and current environmental conditions (temperature, humidity, leaf wetness hours) are assembled into a structured prompt sent to a fine-tuned Llama 3.1 70B model running on AWS Bedrock. The model outputs a diagnosis, confidence level, differential diagnoses, and an actionable treatment plan.

Diseases Covered. AI Scout has been validated against the following pathogens with >94% accuracy on held-out test sets:

  • Fire Blight (Erwinia amylovora) — Detects shepherd’s crook, ooze droplets, and canker margins
  • Apple Scab (Venturia inaequalis) — Identifies olivaceous lesions on leaves and fruit
  • Powdery Mildew (Podosphaera leucotricha) — Recognizes white mycelial growth on shoot tips
  • Sooty Blotch & Flyspeck — Distinguishes cosmetic surface fungi from internal rot
  • Cedar Apple Rust (Gymnosporangium juniperi-virginianae) — Identifies yellow-orange lesions with aecia
  • Black Rot (Botryosphaeria obtusa) — Detects “frog-eye” leaf spots and fruit-end rot
  • Brown Rot (Monilinia fructicola) — Identifies tan spore masses on stone fruit
  • Bacterial Canker, Cytospora, Phytophthora Crown Rot — Trunk and root pathologies

Chemical Advisor. Once a diagnosis is confirmed, AI Scout generates a spray recommendation that accounts for: the pathogen’s FRAC (Fungicide Resistance Action Committee) group to enforce resistance management rotation, the cultivar’s current phenological stage, days to anticipated harvest for PHI compliance, current weather (rain forecast affects protectant vs. systemic choice), and the grower’s historical spray records to avoid exceeding annual application limits.

Knowledge Sources. AI Scout’s knowledge base is updated quarterly from: WSU Tree Fruit Extension Crop Protection Guide, UC Davis IPM Pest Management Guidelines, USDA ARS Germplasm Resources Information Network (GRIN), Penn State Fruit Research & Extension Center, and Cornell Cooperative Extension. All sources are versioned and citations are provided with every diagnosis.

Edge Mode. The complete RAG pipeline runs offline on the NVIDIA Jetson Orchard Node using a quantized Llama 3.1 8B model (GPTQ 4-bit) and a local FAISS index replica. Diagnosis quality is slightly lower (90% vs. 94% on cloud) but remains production-grade for in-field use when cellular connectivity is unavailable.

Fleet of autonomous survey drones launching in formation over a cherry orchard at sunrise for multi-spectral canopy mapping
Autonomous Drones + Computer Vision

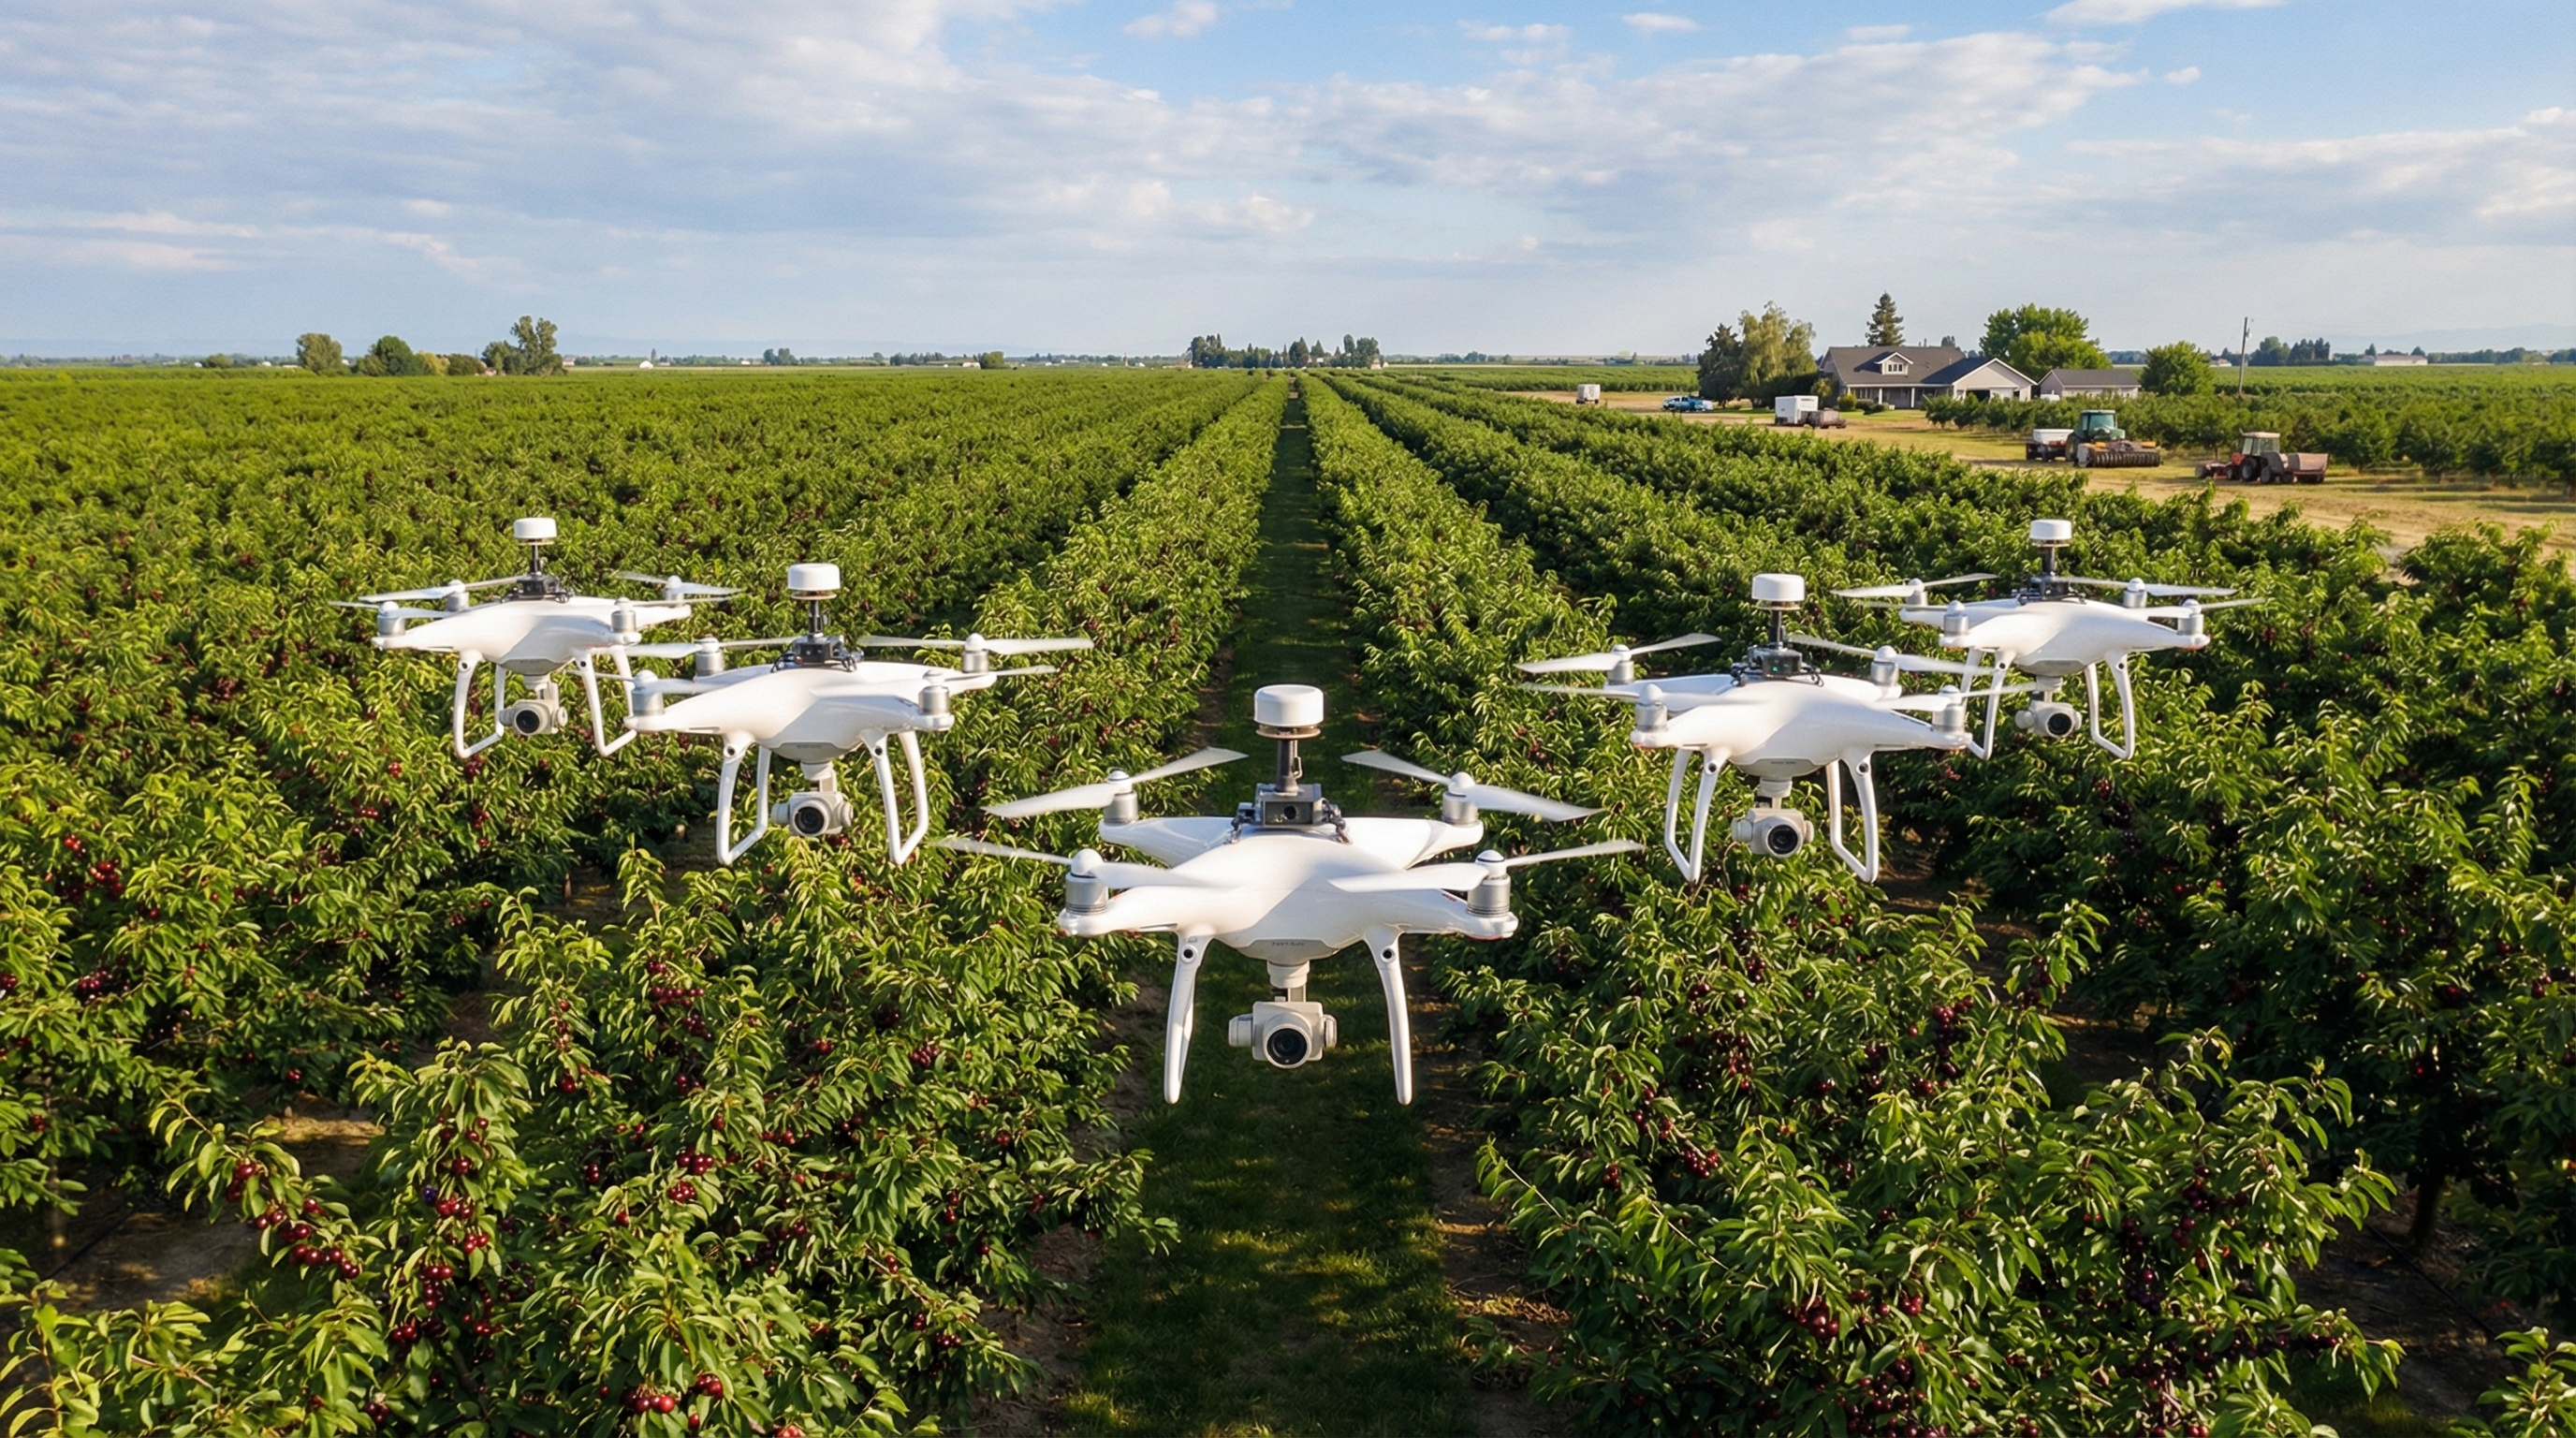
Yield Vision Autonomous Drones

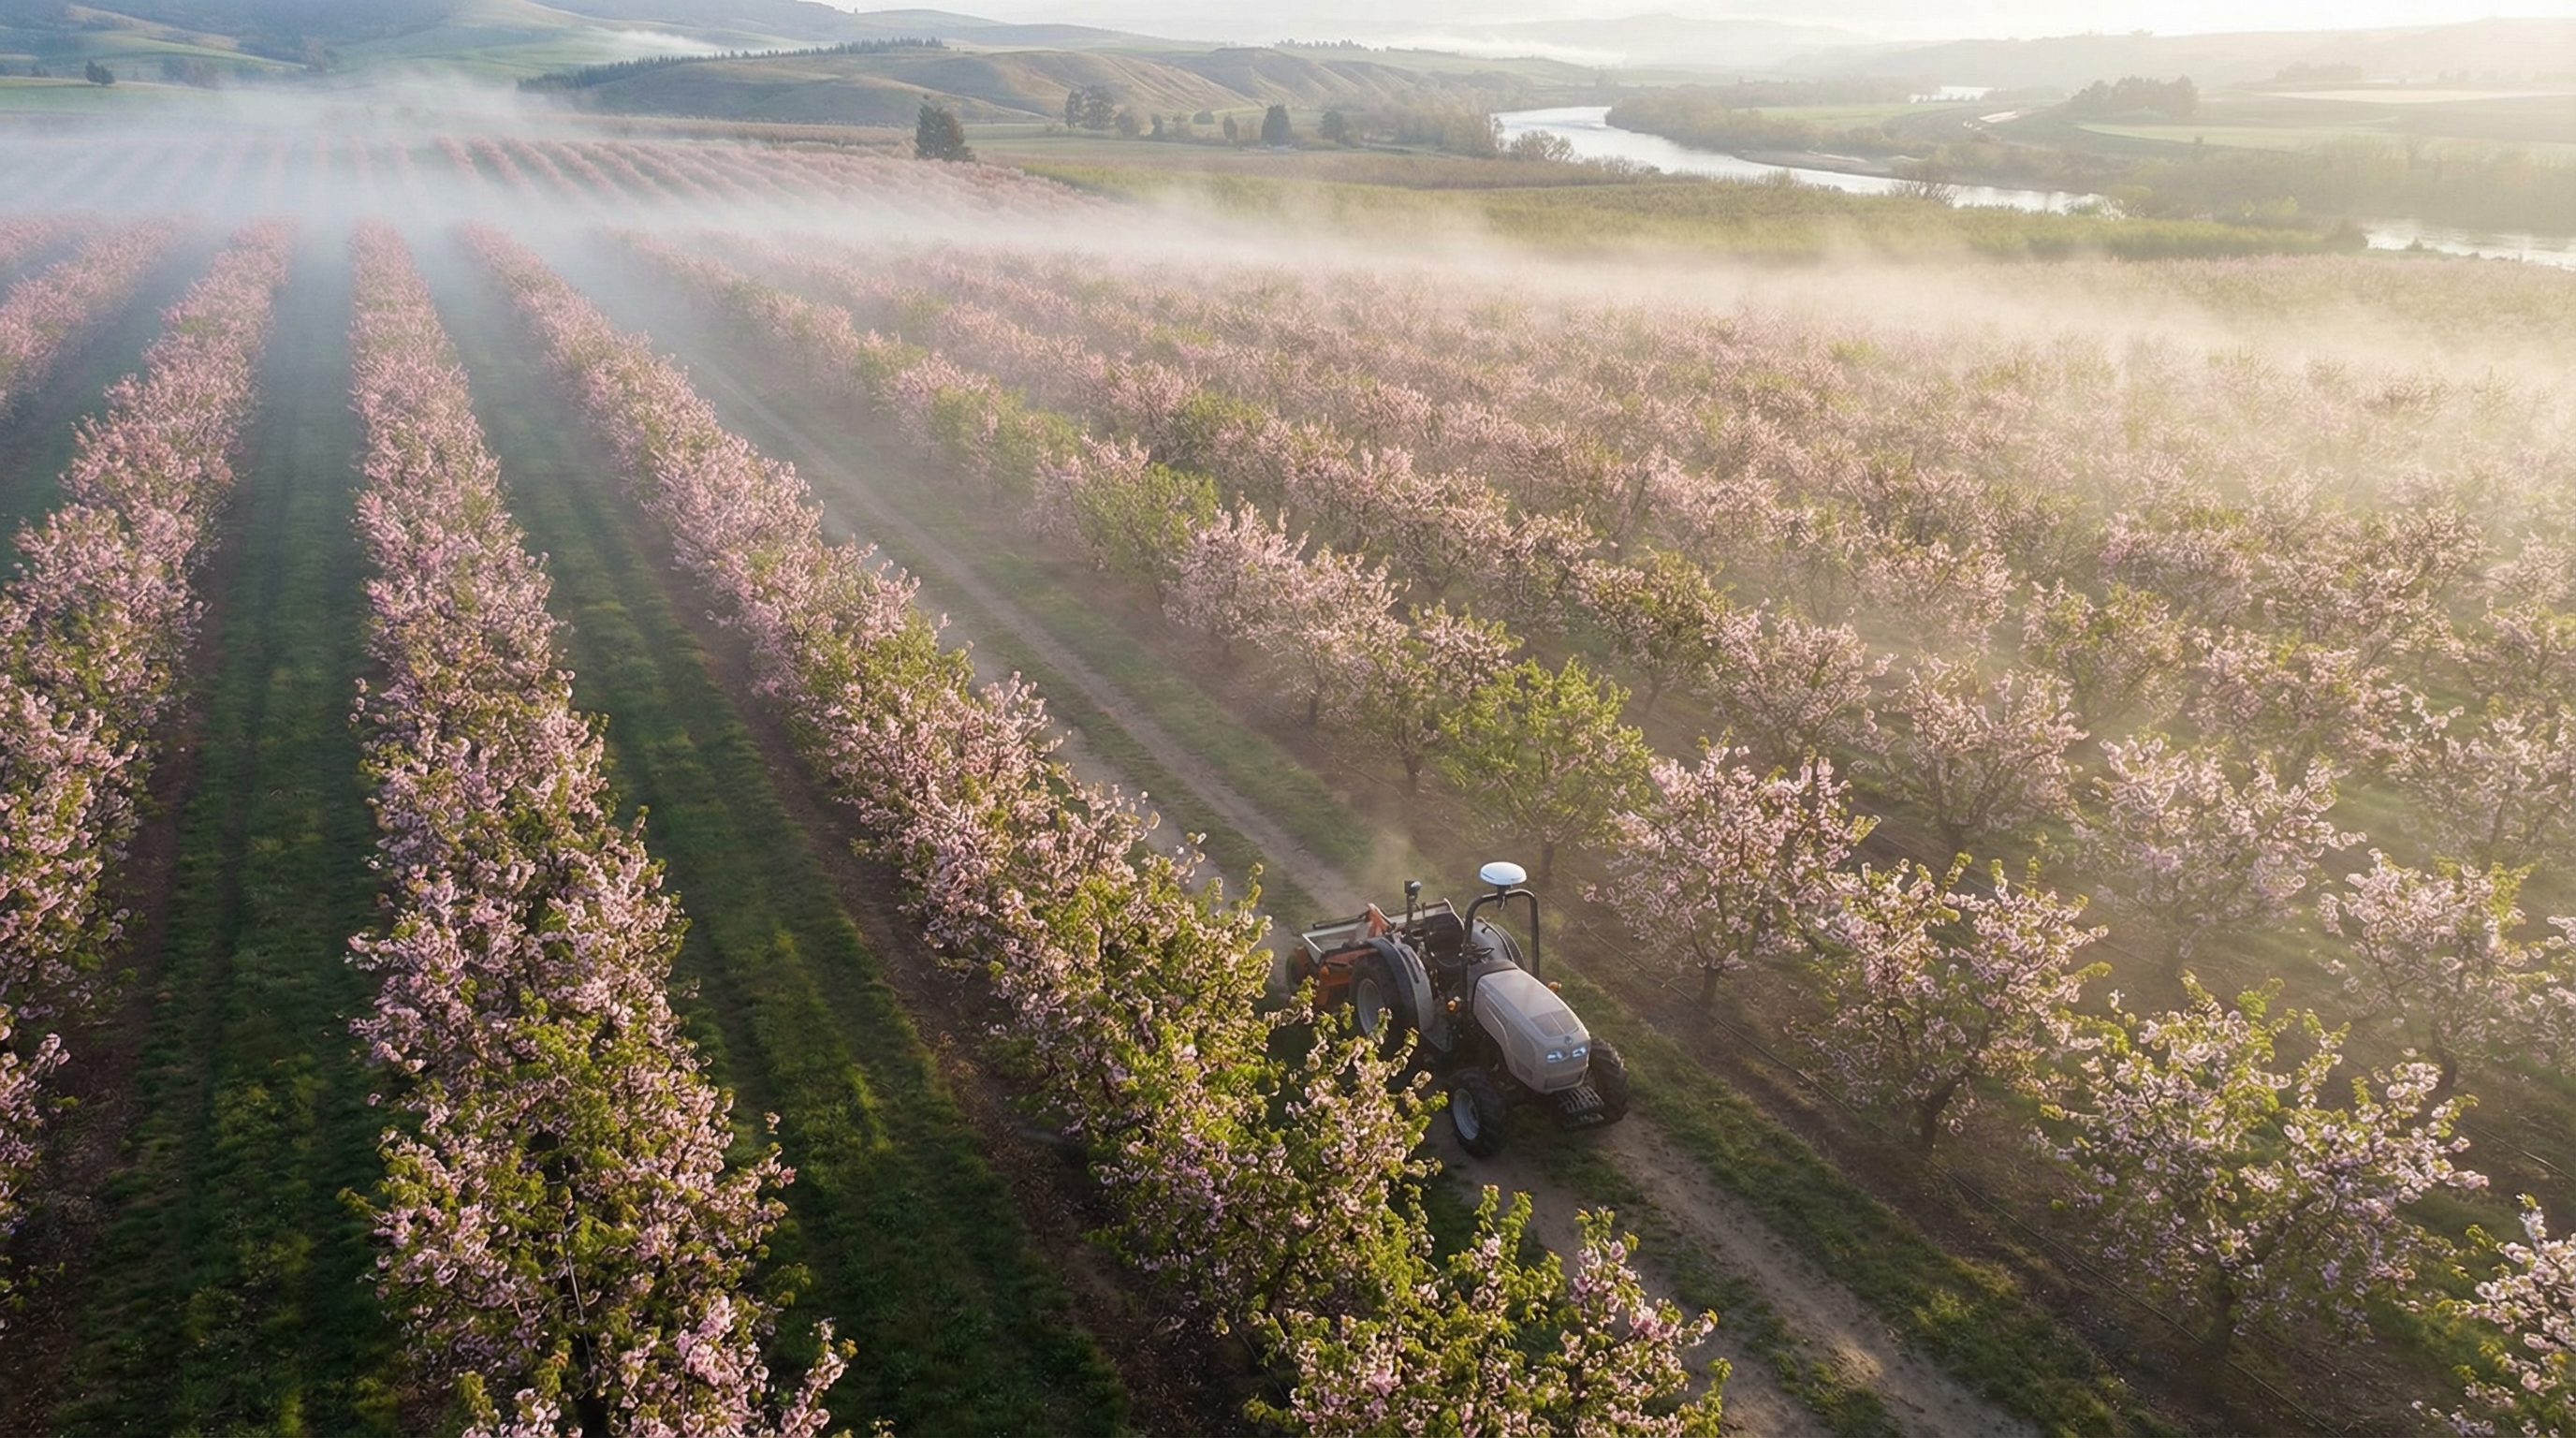
Manual fruitlet counting is impractical beyond a few sample trees. Zooberry’s Yield Vision deploys autonomous drone fleets that survey your entire orchard in hours, producing per-tree fruit counts, canopy health maps, and thinning recommendations that replace weeks of human scouting.

Fleet Hardware. Yield Vision operates DJI Matrice 350 RTK platforms equipped with a dual-payload gimbal: a 61MP Hasselblad RGB camera for fruitlet identification and a MicaSense RedEdge-P five-band multi-spectral sensor (Blue, Green, Red, Red Edge, NIR) for vegetation index analysis. RTK positioning via a Trimble R12i base station ensures every image is georeferenced to ±2 cm—accurate enough to map individual trees.

Automated Flight Planning. The Orchard Node generates mission plans automatically from the orchard’s block map in the Digital Twin. Flight paths use a serpentine grid pattern at 25 m AGL (above ground level) with 80% forward overlap and 70% side overlap, ensuring complete stereo coverage. Terrain-follow mode uses a DSM (digital surface model) generated from the first survey to maintain consistent altitude over sloped terrain. A single M350 RTK covers 80–100 acres per battery set; multi-drone swarms scale linearly.

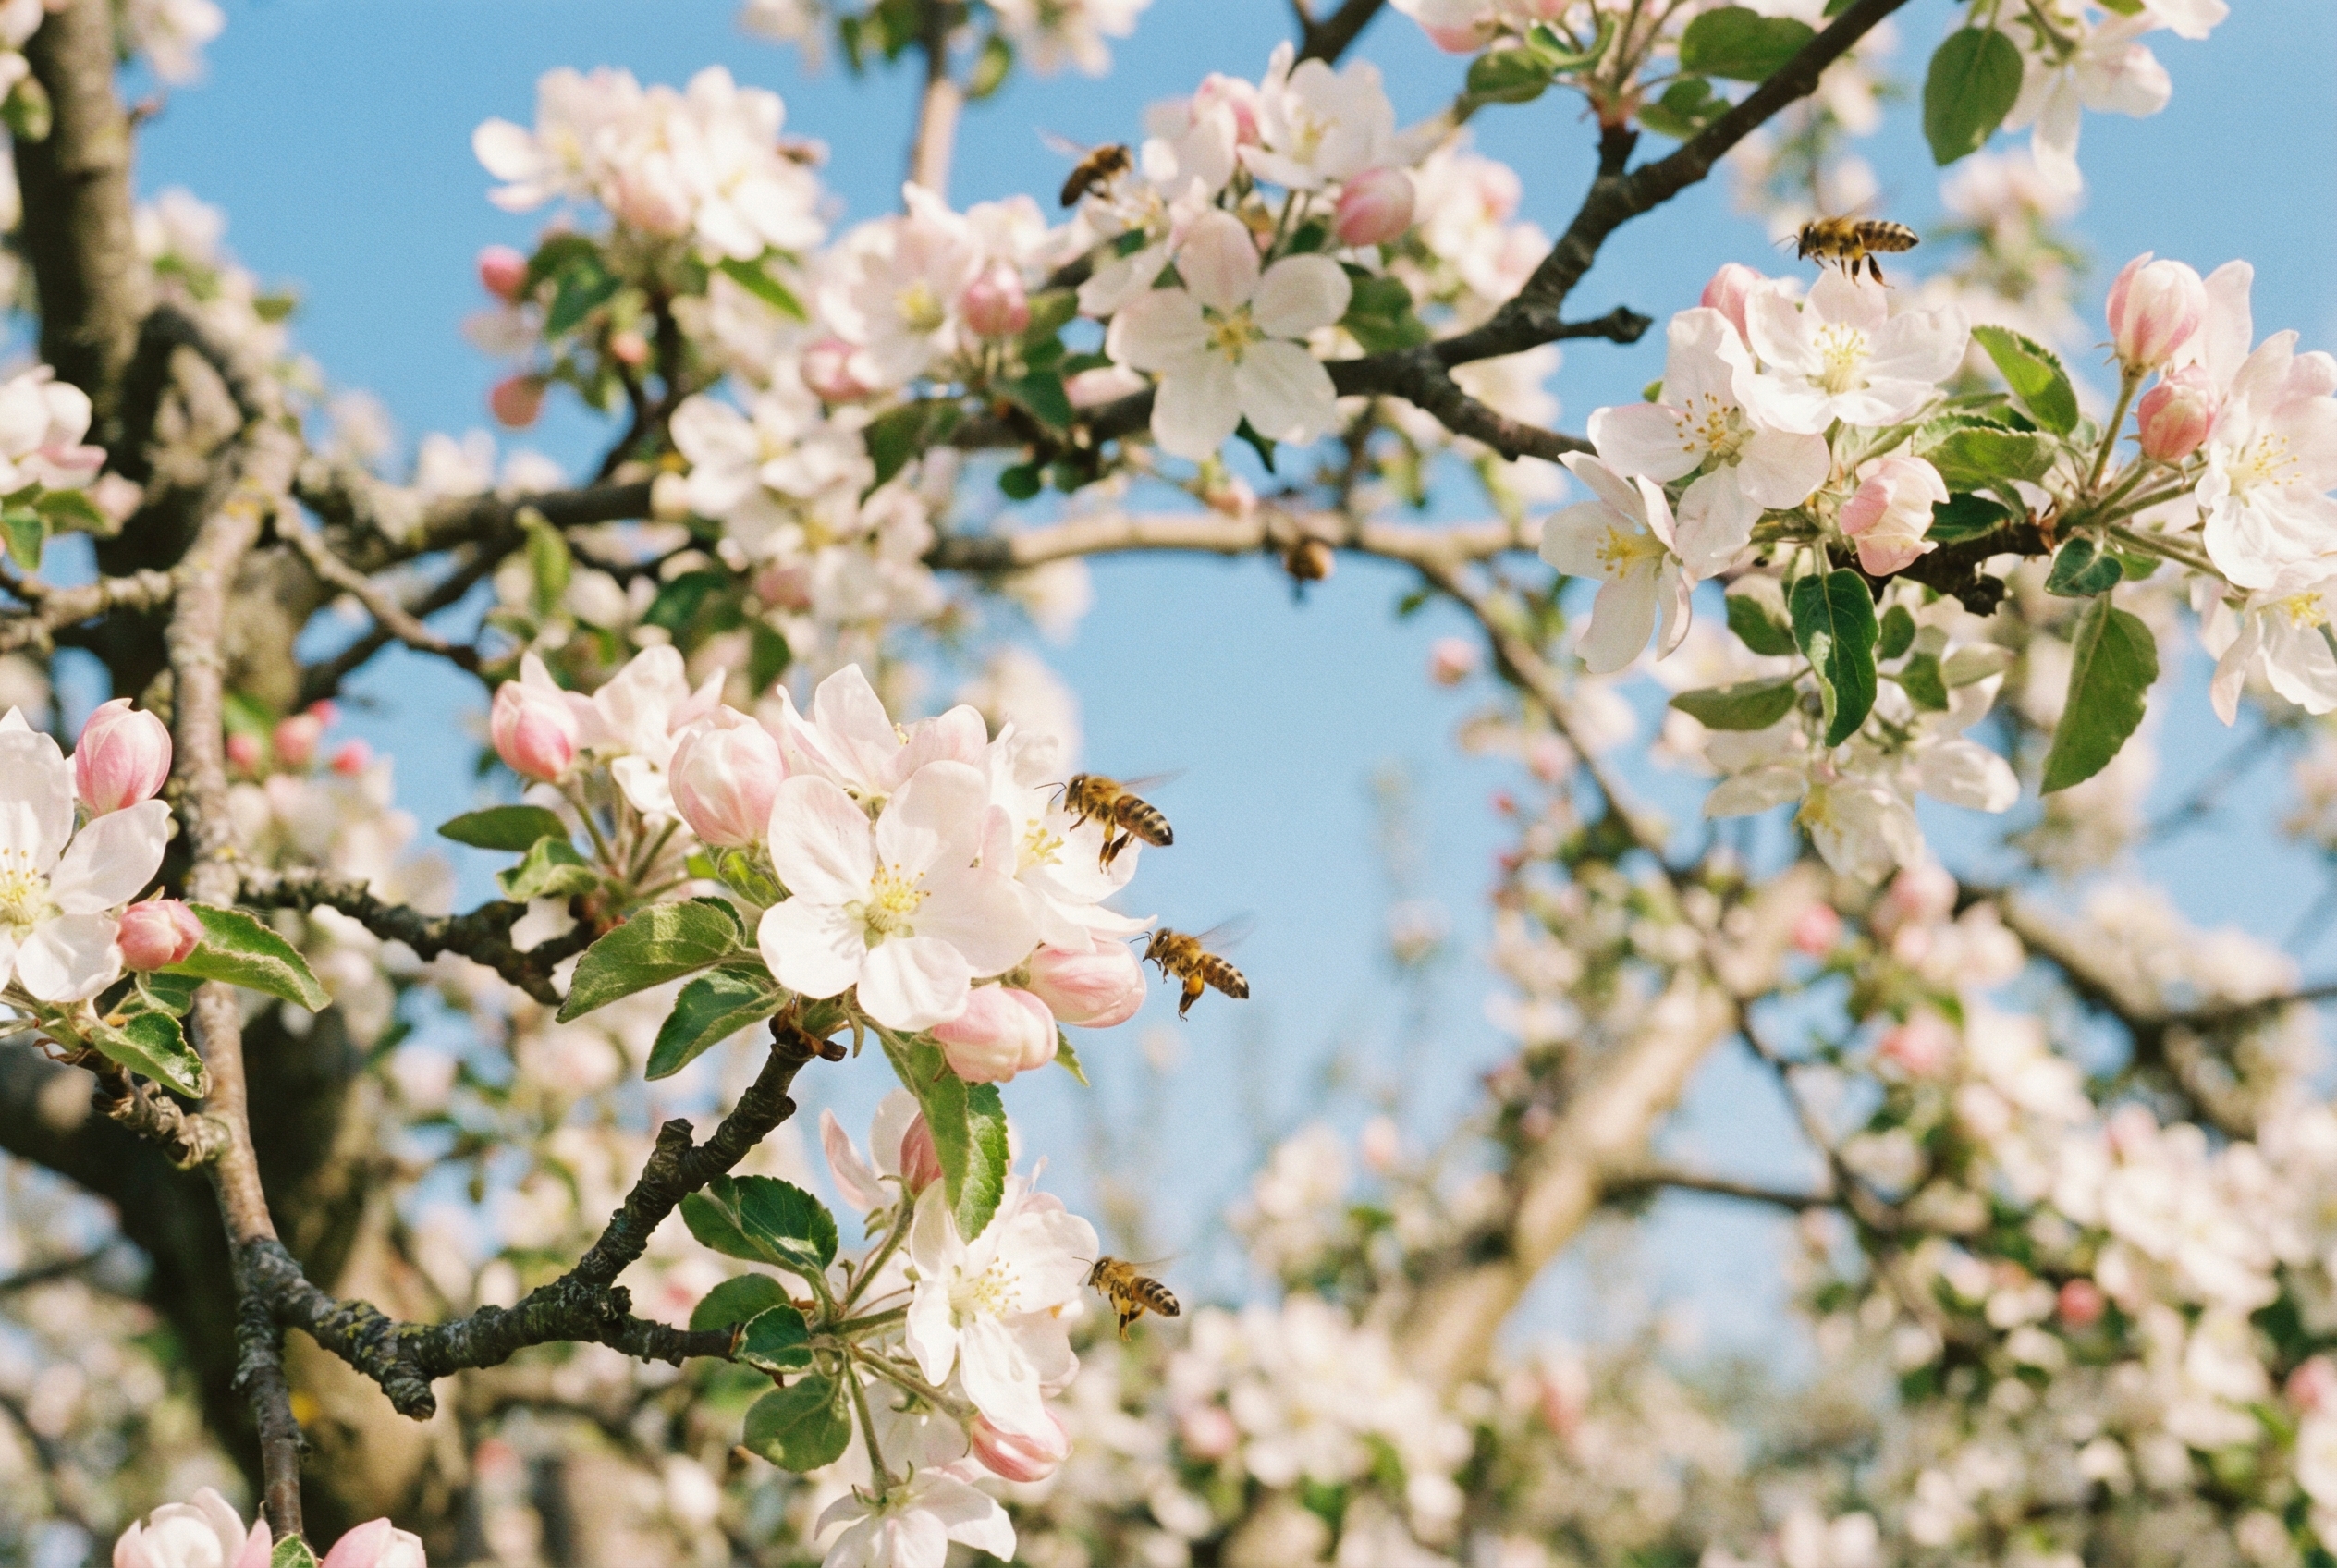
AI Fruitlet Counting. Captured imagery is processed through a YOLOv8x-seg model fine-tuned on 200,000+ annotated fruitlet images spanning apples (Honeycrisp, Gala, Fuji, Granny Smith, Cosmic Crisp), pears (Bartlett, d’Anjou, Bosc), and cherries (Bing, Rainier, Skeena). The model segments individual fruitlets even in dense clusters, handles partial occlusion behind leaves, and distinguishes viable fruitlets from mummies, damaged fruit, and king bloom remnants. Per-tree counts achieve ±8% accuracy against manual ground-truth validation.

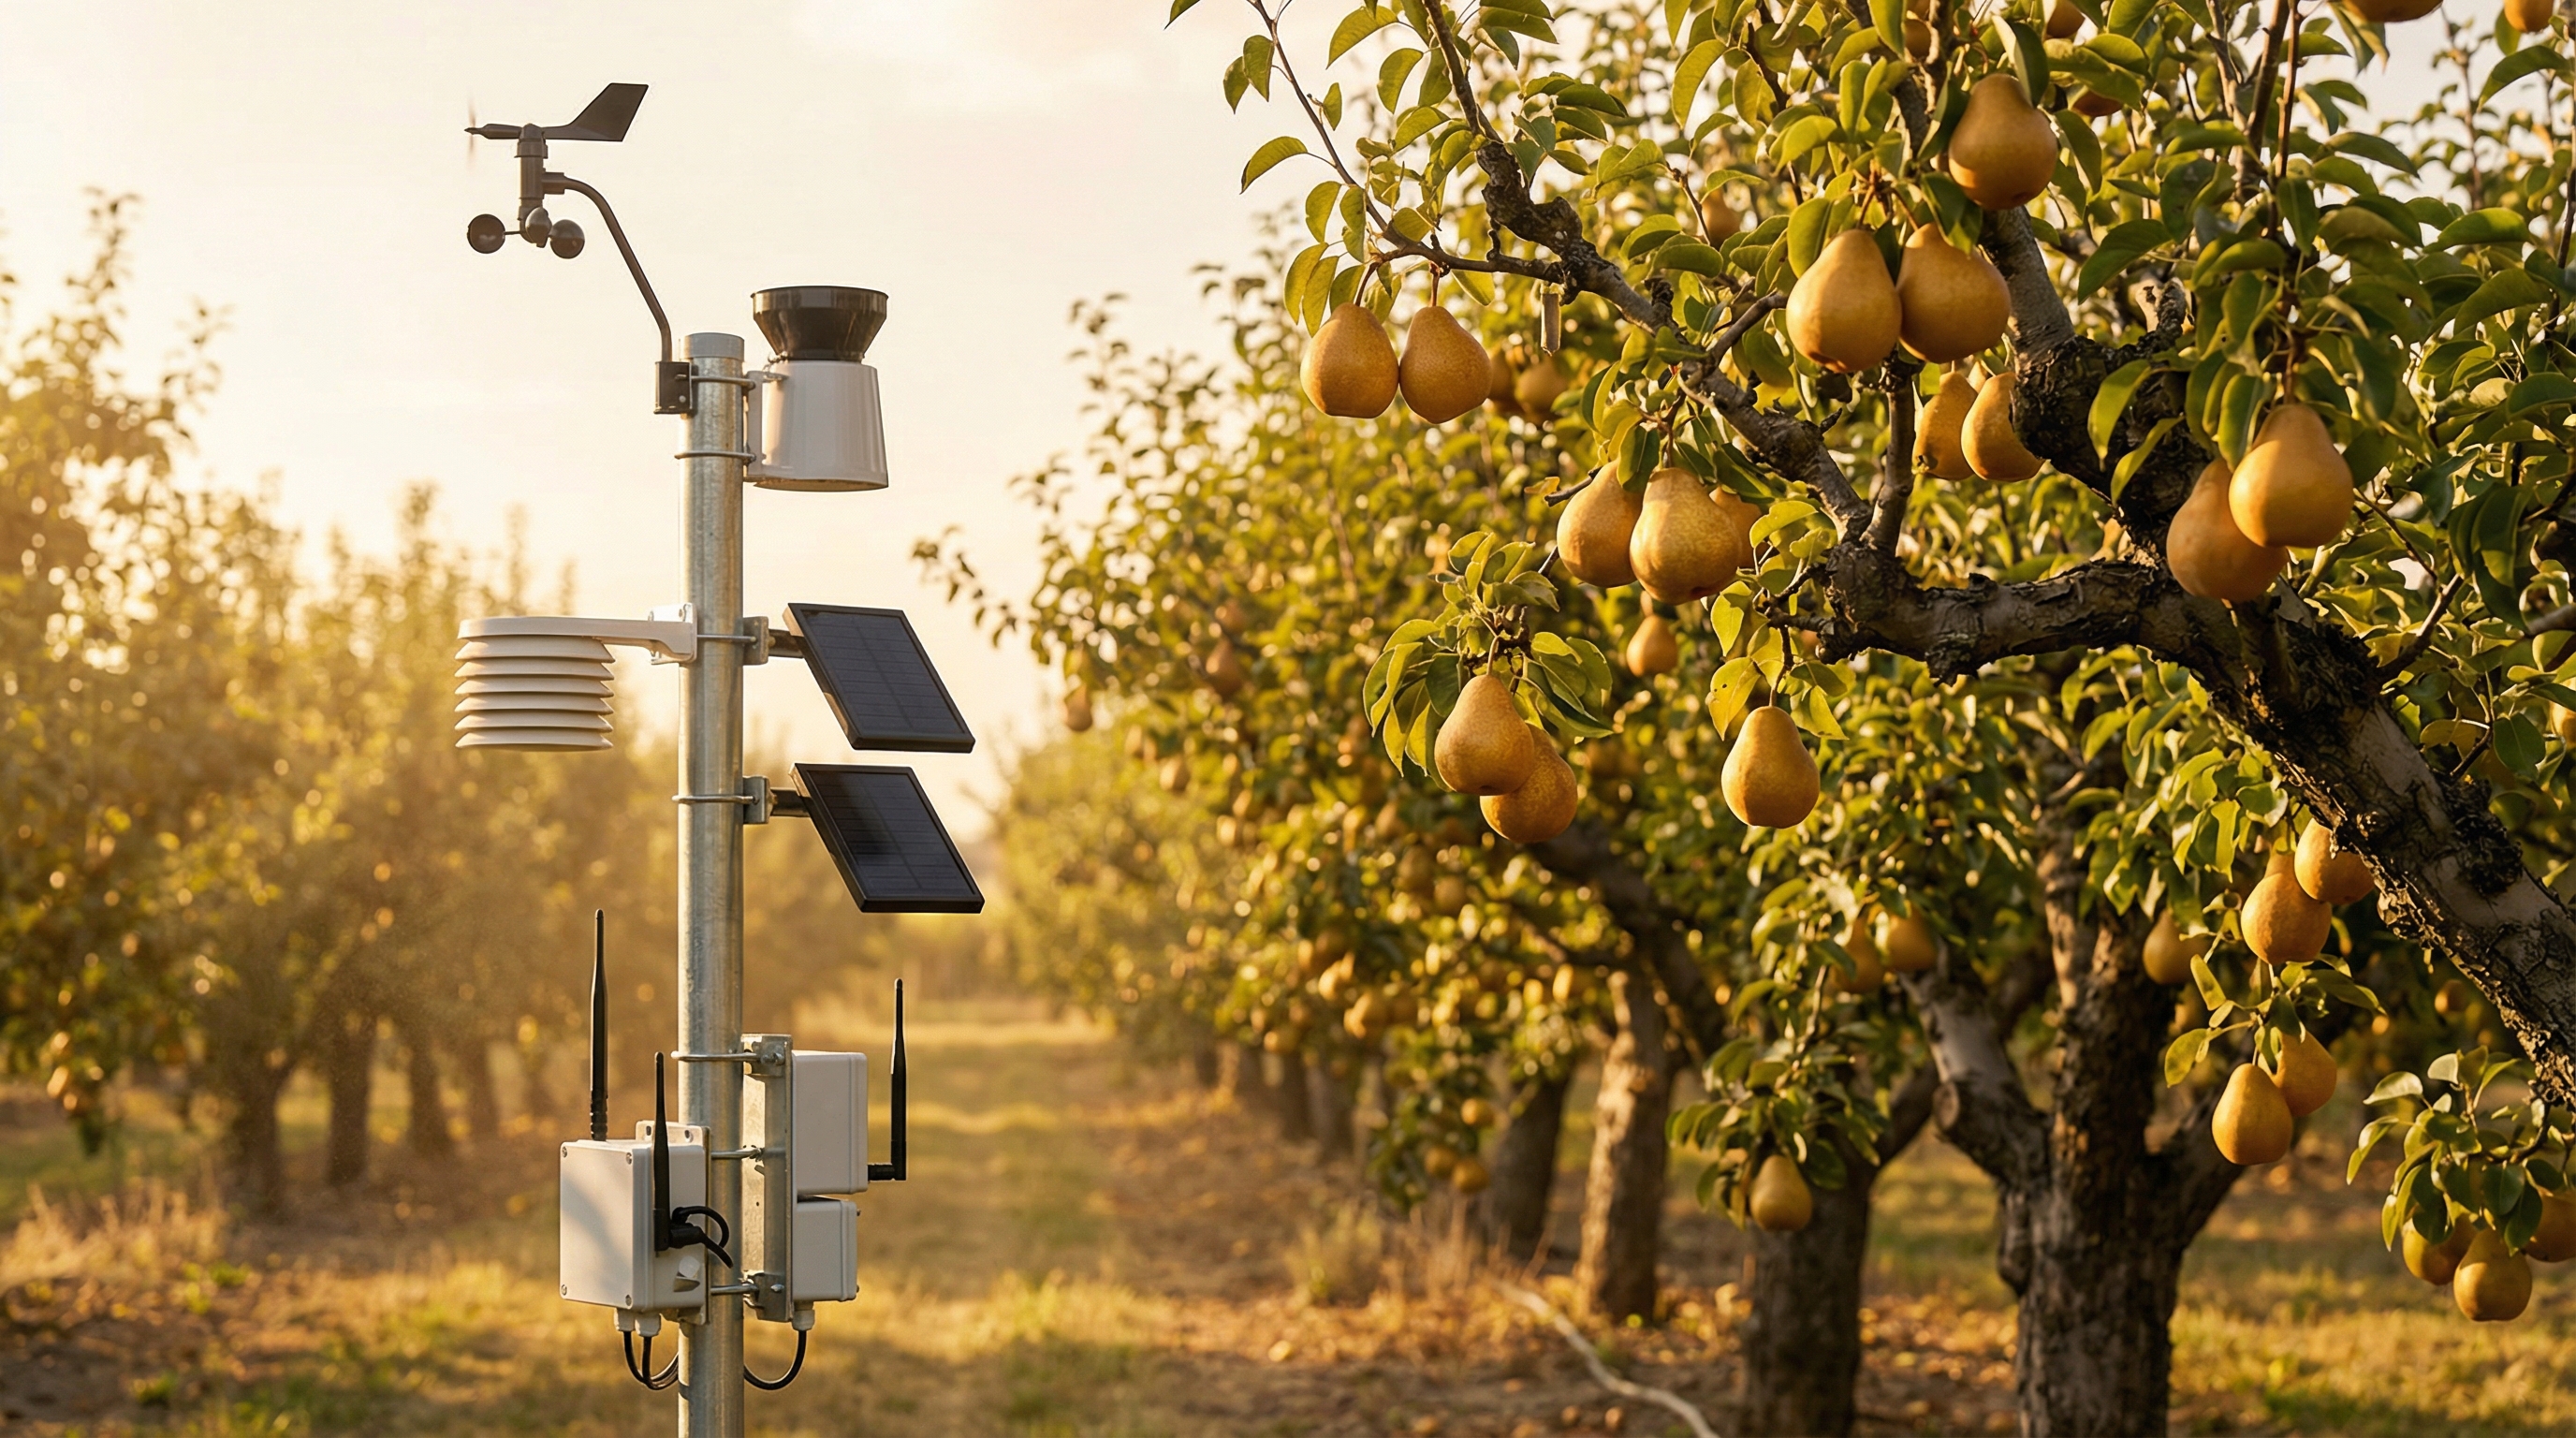
NDVI Canopy Health Mapping. Multi-spectral data produces block-level NDVI (Normalized Difference Vegetation Index), NDRE (Normalized Difference Red Edge), and GNDVI (Green NDVI) maps at 3 cm/pixel resolution. These indices reveal:

  • Water stress zones before visible wilting appears
  • Nutrient deficiency patterns (nitrogen, iron, magnesium)
  • Replant disease corridors in newly established blocks
  • Rootstock vigor differences within the same scion cultivar
  • Early detection of fire blight infection zones from canopy decline

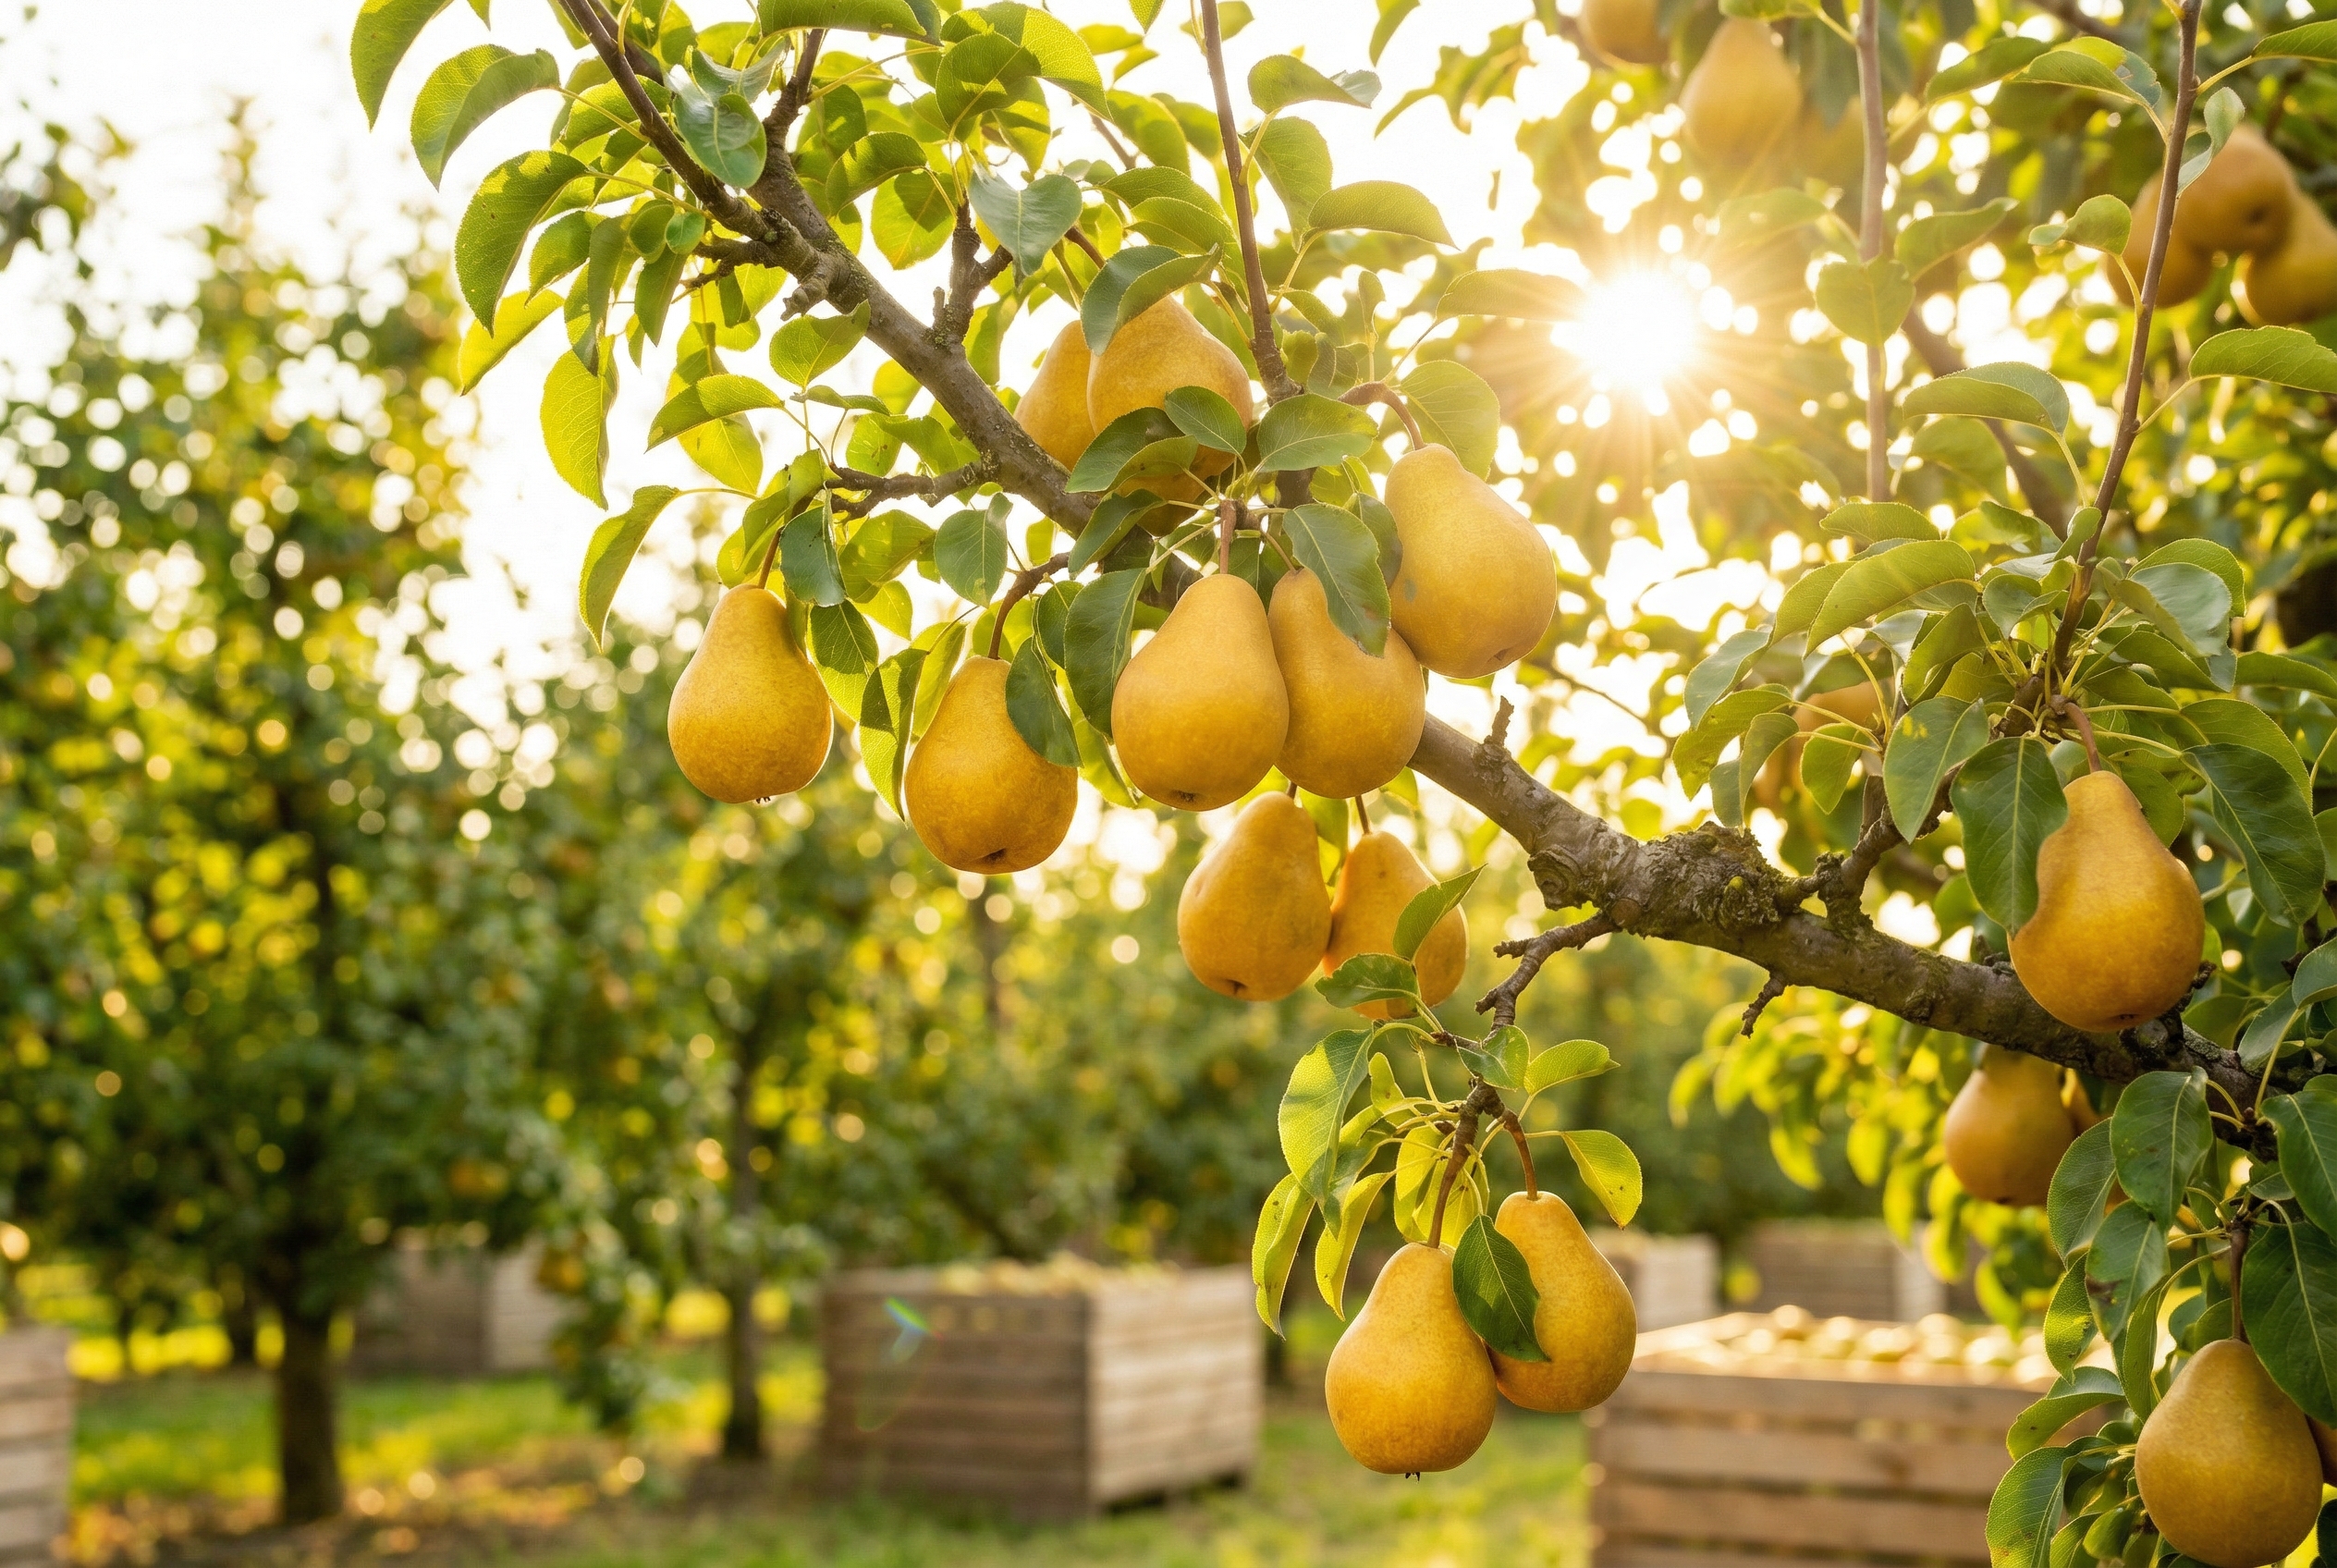
Per-Tree Yield Prediction. Fruitlet counts, canopy volume measurements, and historical yield correlations are fed into the Digital Twin, producing a per-tree yield estimate updated after every drone flight. These estimates aggregate up to block-level, variety-level, and whole-orchard projections—all with confidence intervals.

Thinning Crew Recommendations. Based on fruitlet density vs. target crop load (e.g., 80 fruit per tree for premium Honeycrisp), Yield Vision calculates the number of fruitlets to remove per tree and converts this into labor units. A typical output: “Block 7, Rows 12–38: 2.5 FTE for 3 days at 6.2 seconds/tree hand-thinning rate.” These recommendations integrate directly with the Harvest Environment’s labor scheduling module.

The Foundation Layer

3D Voxel Digital Twin

Every tree in your orchard exists as a living data object—GPS-indexed, voxel-modeled, and continuously updated by drones, robots, sensors, and human scouts. The Digital Twin is the single source of truth that every Zooberry AI agent reads from and writes to.

How It Works

The Digital Twin begins with a high-precision RTK-GPS survey of every tree position, recorded during orchard establishment or generated from drone photogrammetry of existing plantings. Each tree receives a unique identifier (e.g., BLK-07-R14-T003) tied to its GPS coordinates at ±2 cm accuracy.

The voxel model divides each tree’s canopy into a 10 cm × 10 cm × 10 cm volumetric grid. Each voxel stores leaf area density, fruit count (post-drone survey), disease presence probability, and light interception percentage. This 3D structure enables spatial queries impossible with flat maps: “Show me all trees where fruit load in the upper-third of the canopy exceeds 60% of total” or “Highlight every tree with a fire blight probability above 25% within 50 meters of the orchard edge.”

Continuous Updates. The Digital Twin is not a static snapshot. It updates after every data event: drone survey flights (weekly during growing season), robot harvest passes (real-time bin weights and pick locations), IoT sensor readings (every 60 seconds), manual scout observations (photo + GPS tag via mobile app), and packhouse grading data (fruit quality traced back to source tree). Over a season, a single tree accumulates thousands of data points that feed predictive models for the following year.

Access & Visualization. Growers access the Digital Twin through the Zooberry web dashboard (3D WebGL renderer), the mobile app (AR overlay mode using LiDAR on iPhone Pro / iPad Pro), and the desktop Tauri application for large-screen analysis. All views support time-slider playback to review historical changes across seasons.

Feature Detail
Spatial Resolution 10 cm voxel grid per tree; ±2 cm RTK GPS positioning
Update Frequency IoT sensors: 60s • Drone surveys: weekly • Robot passes: real-time • Scout reports: on-demand
Data Sources Multi-spectral drones, LoRaWAN sensors, robotic harvesters, packhouse CV lines, mobile scout app, weather APIs
Storage Backend DynamoDB Global Tables (metadata) + S3 Intelligent-Tiering (voxel payloads, imagery) + OpenSearch (spatial queries)
Edge Sync Orchard Node maintains local replica; bi-directional sync on reconnect via CRDT merge
API Access REST + GraphQL + gRPC; per-tree, per-block, and whole-orchard query scopes; RBAC via Cedar policies
Historical Depth Full tree lifecycle from planting to removal; unlimited season history
Export Formats GeoJSON, Shapefile, CSV, OBJ (3D mesh), glTF (AR), GeoTIFF (raster maps)

Deploy Grow Intelligence on your orchard.

Join the founding cohort of commercial growers running Zooberry’s autonomous Grow Environment across their operation.

Get Early Access